Elections and the markets: 4 lessons from the past
The U.S. political landscape has taken several twists this summer, which likely won’t be the last before the November election. Given the country’s highly polarized political environment and the disparate policy principles, many investors may wonder whether the election’s outcome will affect financial markets — and whether they should alter their investment strategy accordingly.
The good news is that while this election may feel different — they all do at some point — it’s hard to find evidence that politics is a long-term determinant of market performance. This has held true over the long term as well as over past eight years.
Here are four lessons we can draw from history:
1. Markets don’t favor a party.
Despite the temptation to tie market outcomes to election results, stocks have performed well under both Republican (R) and Democratic (D) presidents. The strongest returns occurred during the F. Roosevelt (D), Clinton (D), Eisenhower (R) and Reagan (R) presidencies.
Since 1930, there have been 23 U.S. presidential elections, with Democratic candidates winning 13 times and Republicans prevailing the remaining 10. The average annualized price return (excluding dividends) of the S&P 500 was 9.6% when a Democrat won and 5.7% when a Republican won. But when looking at longer-term horizons, such as 10 years post-election, results for both parties are similar, with the S&P 500 returning around 7%.1
The same pattern is observed over the past two administrations. Despite the sizable chasm between Joe Biden’s and Donald Trump’s policies and both experiencing equity bear markets (one caused by the pandemic during the Trump presidency and the other by aggressive Fed tightening during the Biden presidency), stock market returns have been nearly identical. The S&P 500 has returned 14% per year after dividends under each president, highlighting that markets are neither biased toward one party nor exclusively driven by election outcomes.1

This chart shows the S&P 500 performance during Trump vs. Biden presidency. Past performance does not guarantee future results.

This chart shows the S&P 500 performance during Trump vs. Biden presidency. Past performance does not guarantee future results.
2. Fundamental conditions drive market performance.
While headlines and investor sentiment may influence short-term market movements, fundamentals guide long-term performance. Factors such as inflation, the economy and Federal Reserve policy exert more substantial influence on performance than election cycles. This is a lesson investors relearn every four years.
The U.S. is a $28 trillion economy driven by consumer spending. It isn’t re-engineered because of an election result. Instead, interest rate conditions, financial imbalances and outside shocks can produce downside surprises.
Over the past 40 years, there has been only one instance when market returns were negative 12 months after an election. That was during the burst tech bubble in 2000.1 As the following table shows, even though stocks were down significantly three months after the 2008 November election, they managed to eke out a gain one year later. In both 2000 and 2008, market declines can be attributed to outside macro factors or financial imbalances rather than politics.
Also evident in this table is that the market’s initial reaction to an election’s outcome is often misleading. In six of the last 10 elections, stocks declined the day after election day, but the drop was quickly reversed.1 This is not to downplay the importance of the U.S. presidency or the gravity of this election. But the key takeaway is that the economy does not change course based on an election’s result.

This chart shows S&P 500 total returns on election years 1984 - 2020.

This chart shows S&P 500 total returns on election years 1984 - 2020.
3. Repositioning your portfolio based on potential policy changes can be a risky strategy.
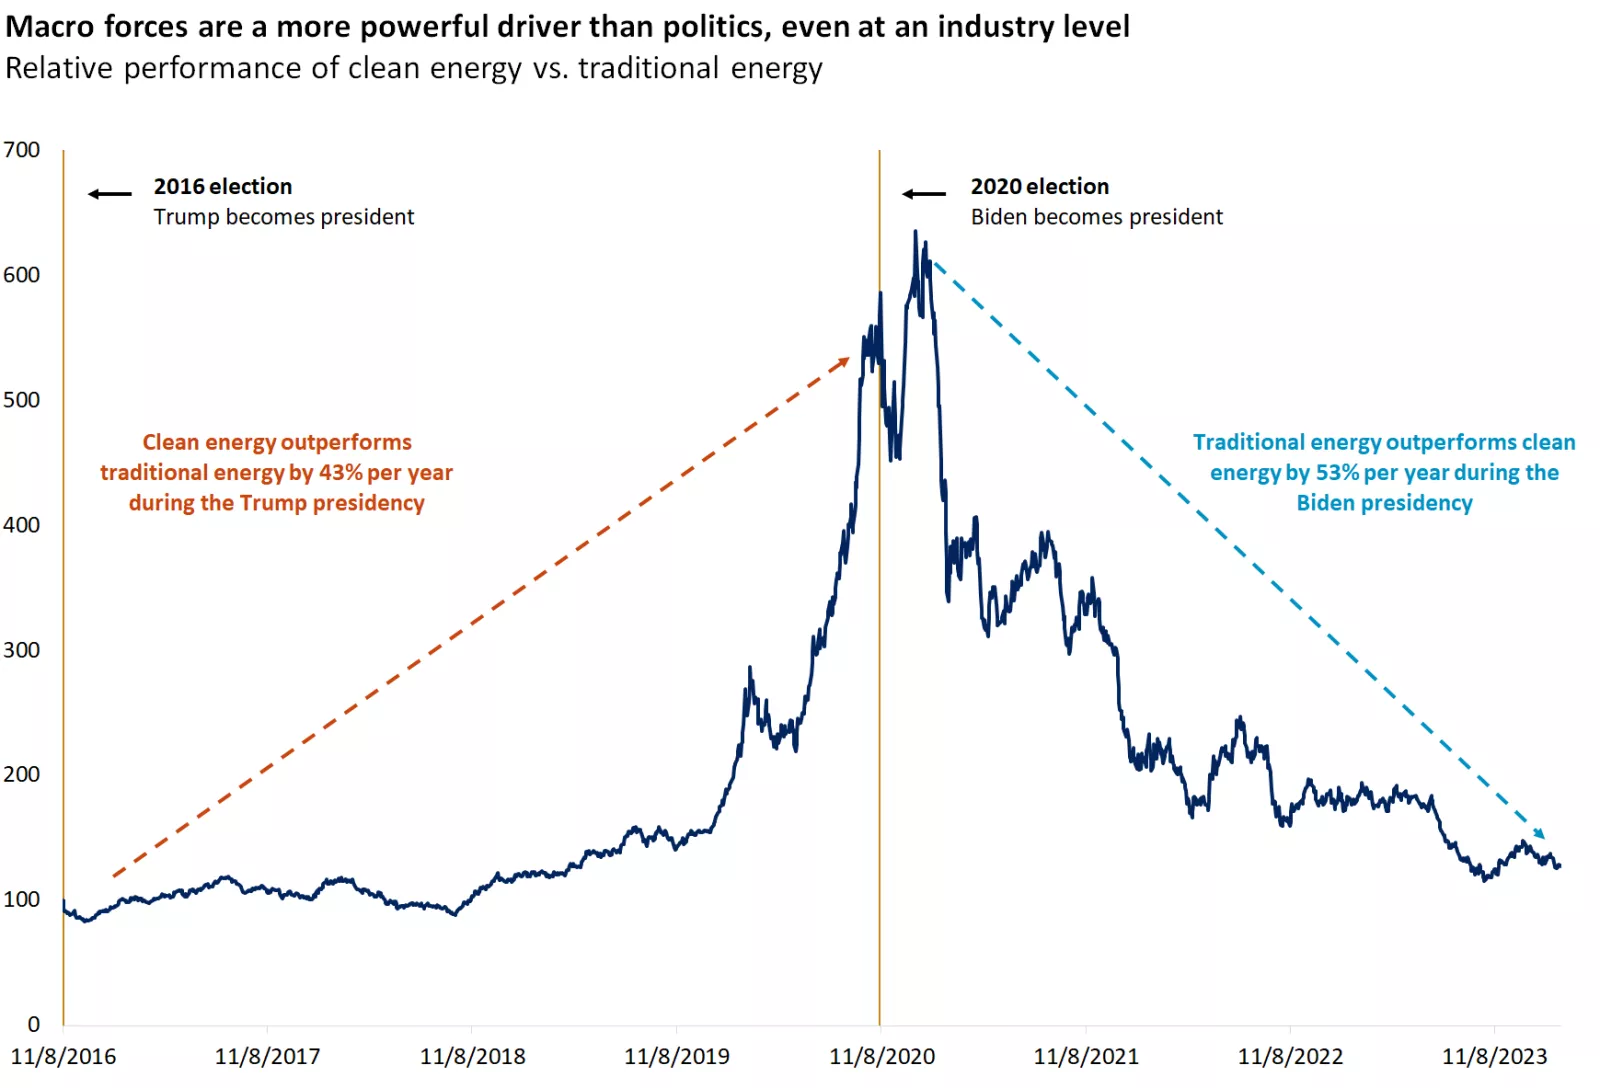
While the economy and the broader equity market are harder to influence, certain sectors such as health care, traditional energy, clean energy, aerospace and defense tend to be more sensitive to the likelihood of a particular candidate winning the election. But you don’t have to go back many years to find that the “winners” and “losers” from an industry perspective are still guided by key macro forces.
With Trump favoring traditional energy sources such as oil, natural gas and coal, and Biden supporting a transition to renewable energy to address climate change, the instinctive choice would have been to overweight the traditional energy sector after the 2016 election and renewables after the 2020 election. However, that strategy would have yielded poor results: During the Trump presidency, clean energy outperformed traditional energy by 43% per year. During the Biden presidency, traditional energy outperformed clean energy by 53% per year.1
Along with views on energy policy, the key election issues at stake this year from an investor standpoint are taxes, tariffs and immigration. The Trump administration's deregulation agenda and lower taxes could possibly aid economic growth, but an aggressive approach to tariffs and immigration could be inflationary and lead to higher interest rates. On the Democratic side, Kamala Harris, the presumptive Democratic nominee, likely won’t meaningfully deviate from the current administration’s policies on trade and taxes.
Regardless of which candidate wins the presidency, we think there is a high chance Congress remains divided, and thus policy gridlock will likely continue. While it will be difficult to pass any major new legislation or reform, the system of checks and balances remains intact. Markets may welcome this, as political gridlock also means a more transparent operating environment for companies, with less policy upheaval.

This chart shows relative performance of clean energy vs. traditional energy from 2016 - 2023.

This chart shows relative performance of clean energy vs. traditional energy from 2016 - 2023.
4. Volatility is likely to rise but could prove short-lived.
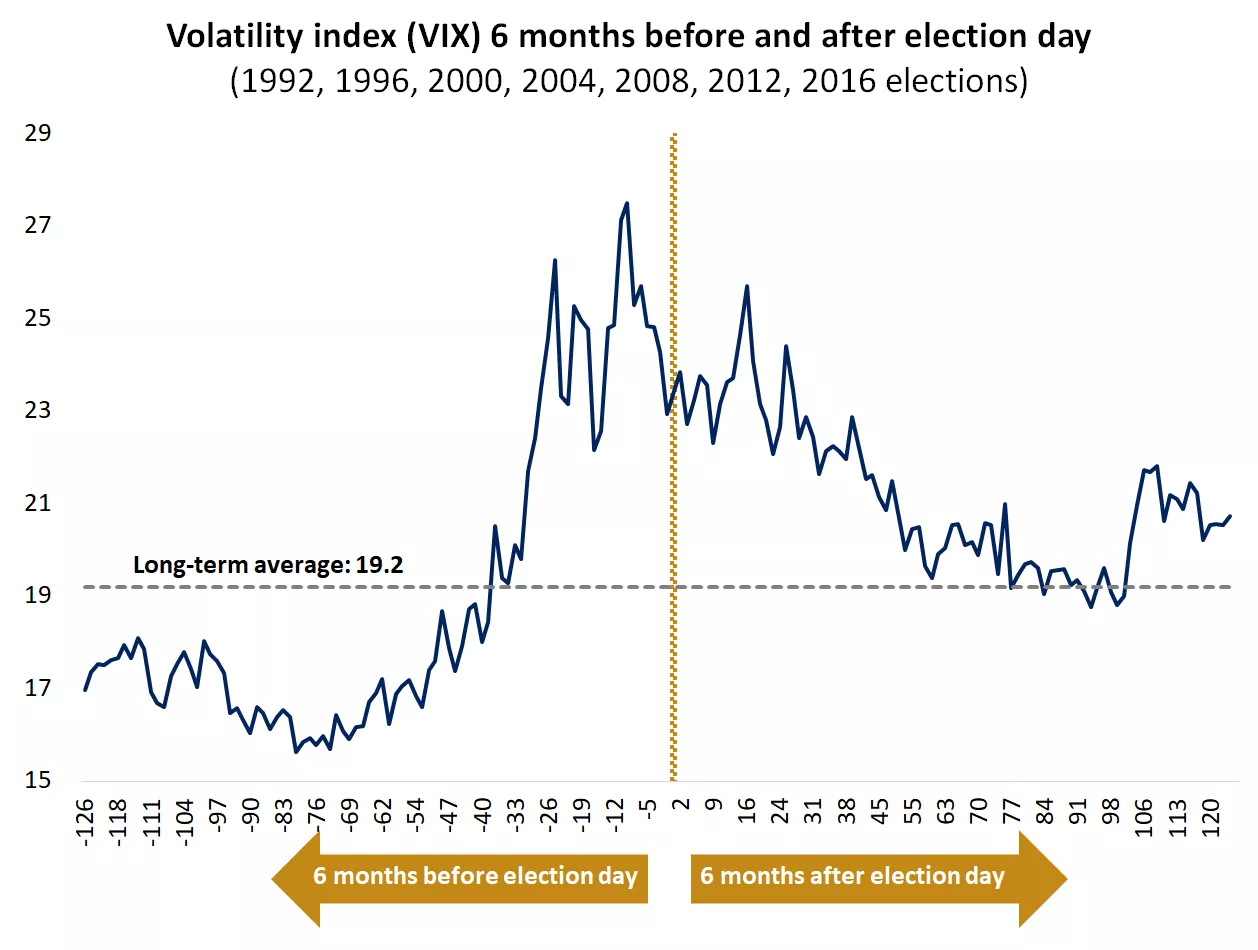
While fundamental conditions predominantly determine market performance, elections can influence short-term volatility. Anxiety and uncertainty tend to rise as November approaches. This may explain why market volatility (as proxied by the CBOE Volatility Index, or VIX) has tended to rise notably two months before election day.2 By 30 days after the vote, however, volatility has somewhat subsided, returning to normal 60 days post-election.
It’s also worth noting that, excluding the 2000 and 2008 bear markets, the observed rise in volatility is more consistent with the historical pattern and negative seasonality typically seen during September and October.2

This chart shows volatility index (VIX) 6 months before and after election days.

This chart shows volatility index (VIX) 6 months before and after election days.
Actions to consider
- The growth and resiliency of the U.S. economy and markets don’t change with each election, and neither should your investment strategy. Resolve to stay the course and not react to political headlines.
- Given the polarized political climate and potential policy shifts, equity market fluctuations could increase as we approach November. But any election-driven weakness will, in our view, prove fleeting. This could present a compelling opportunity to add quality investments or diversify portfolios.
- Rising corporate profits, continued economic expansion and the potential for lower yields later in the year provide a positive backdrop for the markets, in our view. We expect this environment to be supportive for both stocks and bonds, but in our view, the greater opportunity lies within equities. This is particularly true in areas of the U.S. market that have lagged and carry lower valuations, such as mid-cap stocks.
- Neither political party appears keen to tackle the U.S. fiscal deficit, so debt fundamentals will not likely change. Regardless of which candidate is elected in 2024, it’s reasonable to expect taxes will rise at some point in the future. This may present the opportunity to discuss planning strategies such as Roth conversions with your financial advisor and tax professional.
Angelo Kourkafas, CFA
Investment Strategist
Important information:
1. Source: Morningstar Direct, Edward Jones
2. Source: Bloomberg, Edward Jones
This is for informational purposes only and should not be interpreted as specific investment advice. Investors should make investment decisions based on their unique investment objectives and financial situation. While the information is believed to be accurate, it is not guaranteed and is subject to change without notice.
Before investing in bonds, you should understand the risks involved, including credit risk and market risk. Bond investments are also subject to interest rate risk such that when interest rates rise, the prices of bonds can decrease, and the investor can lose principal value if the investment is sold prior to maturity.
Investors should understand the risks involved in owning investments, including interest rate risk, credit risk and market risk. The value of investments fluctuates and investors can lose some or all of their principal.
Past performance does not guarantee future results.
Market indexes are unmanaged and cannot be invested into directly and are not meant to depict an actual investment.
Diversification does not guarantee a profit or protect against loss in declining markets.
Systematic investing does not guarantee a profit or protect against loss. Investors should consider their willingness to keep investing when share prices are declining.
Dividends may be increased, decreased or eliminated at any time without notice.
Special risks are inherent in international investing, including those related to currency fluctuations and foreign political and economic events.